![]()
The Continental Flood Inundation Mapping Framework
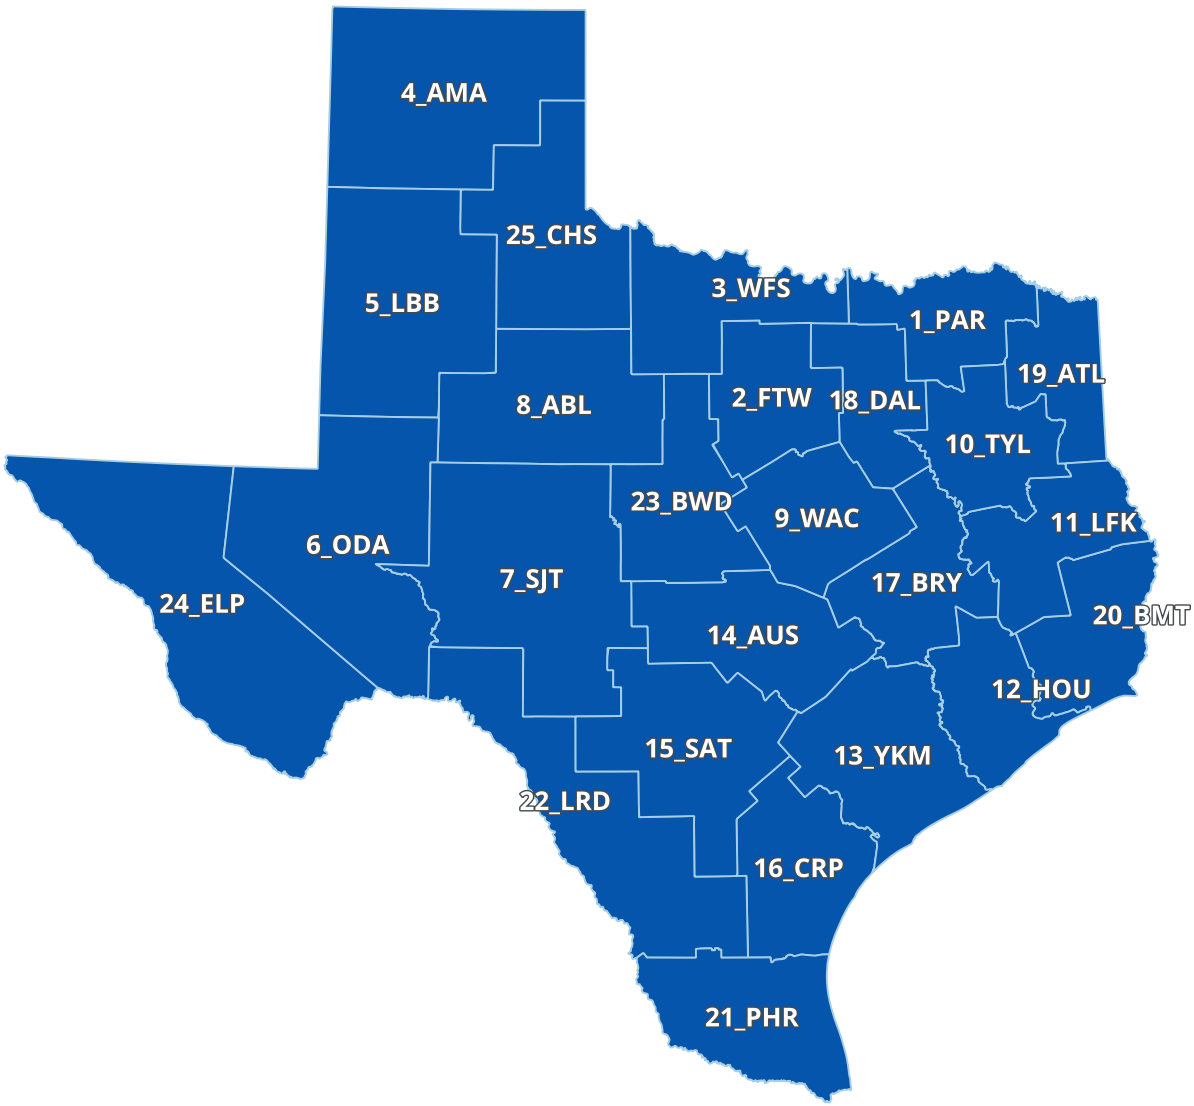
The road elevation model (REM) provides road lidar, road DSM (digital surface model raster), and 3D road shapes (center lines and polygons with XYZ coordinates) for the State of Texas. REM is an essentical building block of the Texas flood geodatabases for road infrastructures. REM data is currently organized by maintenance section in each TxDOT district. Computation is done on GPU computing resources at Oak Ridge National Laboratory (ORNL), through a Strategic Partnership Project with UT Austin and an NSF ACCESS computing allocation award that interconnects TACC Corral and ORNL CADES/OLCF for fast data movement using Globus.
The first version of Texas REM was released on June 19, 2025, with full state coverage. The dataset is hosted at TACC. Please use this URL to access the data:
https://web.corral.tacc.utexas.edu/nfiedata/road3d/
Citation: Yan Liu, David Maidment, Andy Carter, Timothy Whiteaker, Christine Thies, and Harry Evans. 2025. "TxDOT Road Elevation Model Dataset." Dataset released on June 19, 2025. DOI: 10.13139/ORNLNCCS/2574440.
Please refer to the FAQs section for how it was computed.
On July 03, 2025, UT Austin made the Texas road flood forecast system online with full coverage of the 25 TxDOT districts: https://roadflood.com.
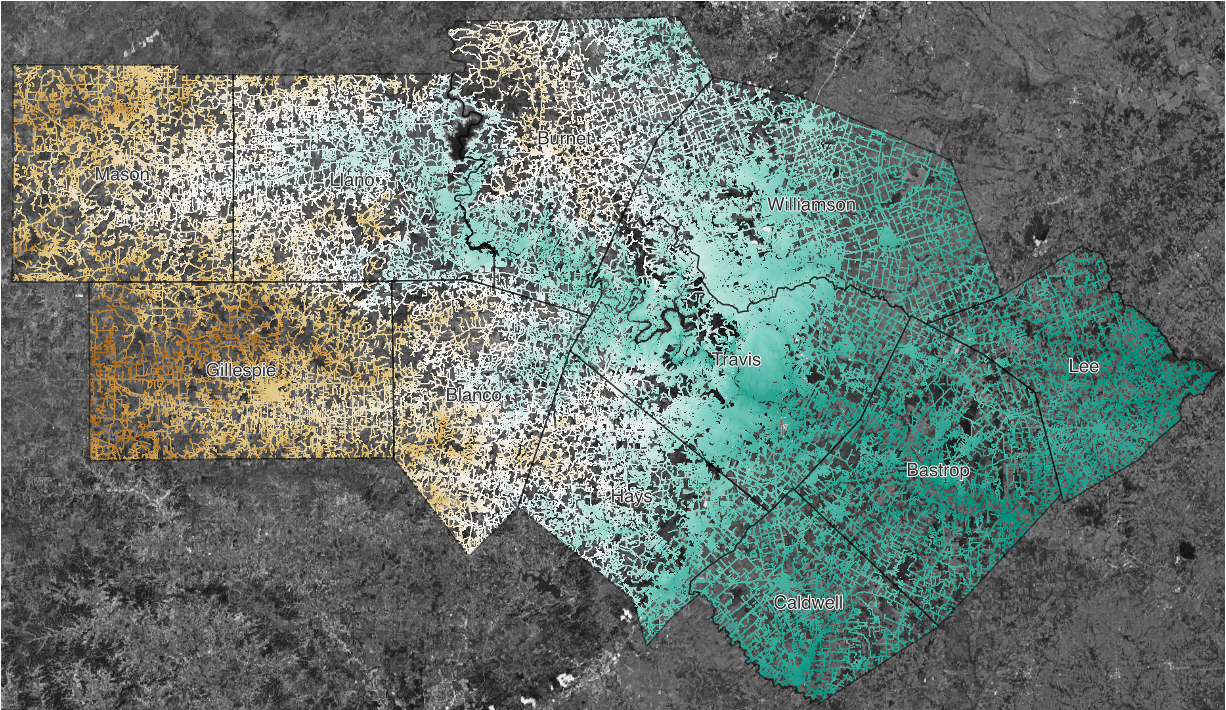
This is a road lidar data collection for developing road elevation models and road inundation mapping methodologies, a joint work between ORNL and The University of Texas at Austin. This dataset is generated as part of the flood transportation infrastructure, partly funded by the NOAA CIROH project. ORNL is a project partner for high-performance computing-empowered flood inundation mapping methodology research. The dataset is computed using a GPU-accelerated lidar data processing workflow developed at ORNL. The lidar data source is from TxGIO, the state lidar data collection site. The output dataset is in two formats: laz and copc. It is organized by TxDOT's maintenance sections, covering the Austin District. Data size: 3.86 billion road lidar points, 1.67% of the entire lidar data input
Projection: EPSG:32614 (WGS84/UTM zone 14N)
Download URL: TxDOT Austin District Road Lidar Dataset, indexed by TxDOT Maintenance Sections.
Documentation: Presentation
Citation: Liu, Yan, David Maidment, Andy Carter, Tim Whiteaker, and Paola Passalacqua. "Road Lidar Dataset for the TxDOT Austin District." United States: N. p., 2024. Web. doi:10.13139/ORNLNCCS/2472925.
Full data download URL: https://web.corral.tacc.utexas.edu/nfiedata/pin2flood/texas/
Citation: Liu, Yan, David Maidment, Andy Carter, Paola Passalacqua, and Tim Whiteaker. "Height Above Nearest Drainage (HAND) at Three-Meter Resolution for the State of Texas." United States: N. p., 2023. Web. doi:10.13139/ORNLNCCS/2204010.
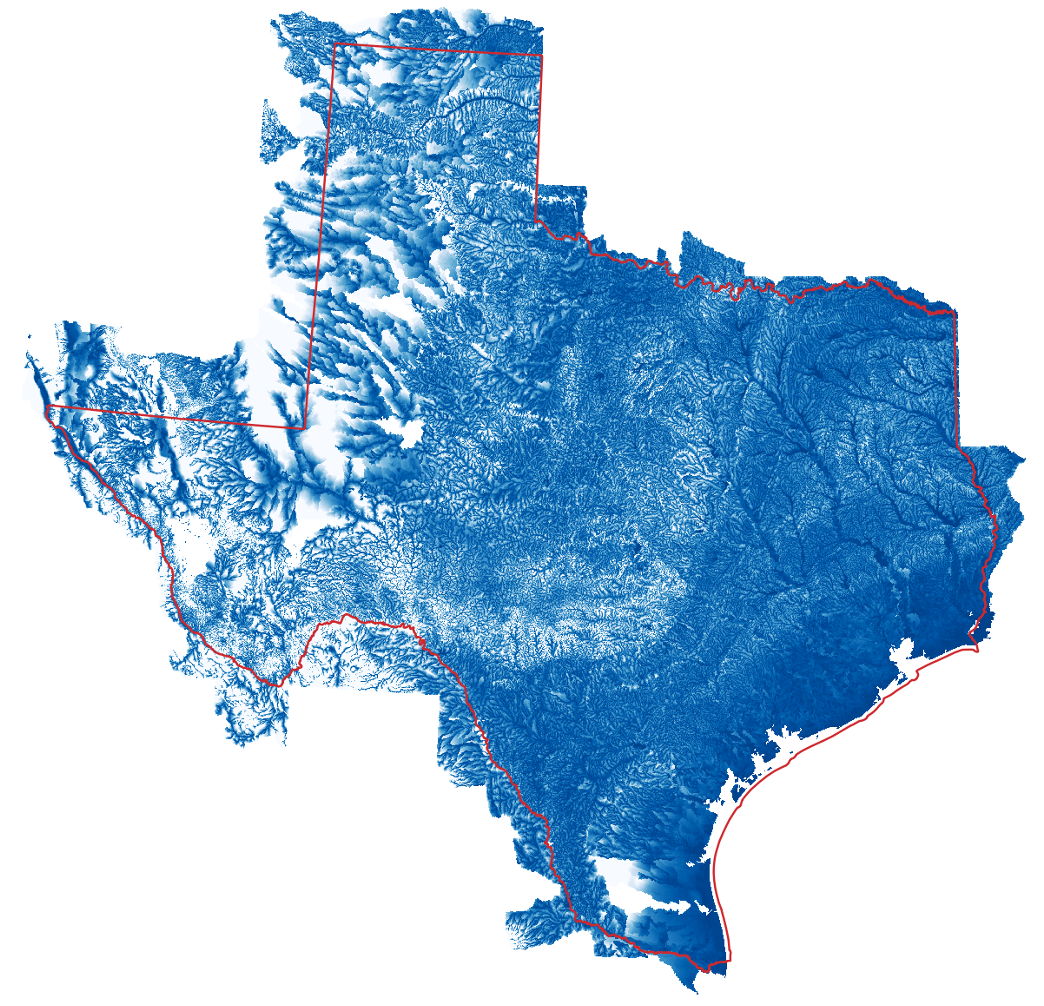
In January 2023, Oak Ridge National Laboratory (ORNL) computed the 3-meter hydrologic terrain and associated synthetic rating curves for the State of Texas, covering 287,535 river streams (approximately 1.5km/stream) in 209 river subbasins, funded by a Strategic Partnership Project (SPP) with the University of Texas at Austin. The computed data products (https://www.osti.gov/dataexplorer/biblio/dataset/2204010) are core datasets for supporting Pin2Flood, a field app for Texas first responders to drop a pin on a mobile device and display nearby flood inundation extent. The Texas Division of Emergency Management (TDEM) officially released the Pin2Flood app in June 2023 (Video link).
The computed Texas hydrologic terrain is the first 3-meter resolution Height Above Nearest Drainage (HAND)-based hydrologic terrain computed at Hydrologic Region scale in the U.S. Its computational intensity is comparable to computing the 10-meter resolution terrain for the continental U.S. ORNL accelerated the underlying scientific workflow and reduced the computing time from a week on 20 computing nodes to 3 days using a single high-memory 128-core machine. The availability of this high-resolution hydrologic terrain significantly improved the accuracy of flood extent mapping in Pin2Flood, verified by seven flood response exercises conducted by hundreds of Texas first responders. The Pin2Flood app is the first production application of the Continental Flood Inundation Mapping framework for flood emergency management. The success of the Pin2Flood has been demonstrated by the official release and that the Pin2Flood operational platform at TDEM was awarded the 2022 Award for Excellence in Public Safety GIS in the state category by the National Alliance for Public Safety GIS (NAPSG) Foundation.
Yan Liu in the Computational Urban Sciences Group, the PI of the SPP project, collaborated with the University of Texas at Austin and Esri in the Pin2Flood project. Computing resources were provided by the Oak Ridge Research Cloud with tremendous help from Chris Layton and Daniel Dewey. The computed Pin2Flood data has been published as an open source dataset for research and review purposes at both TACC and ORNL's CFIM website.
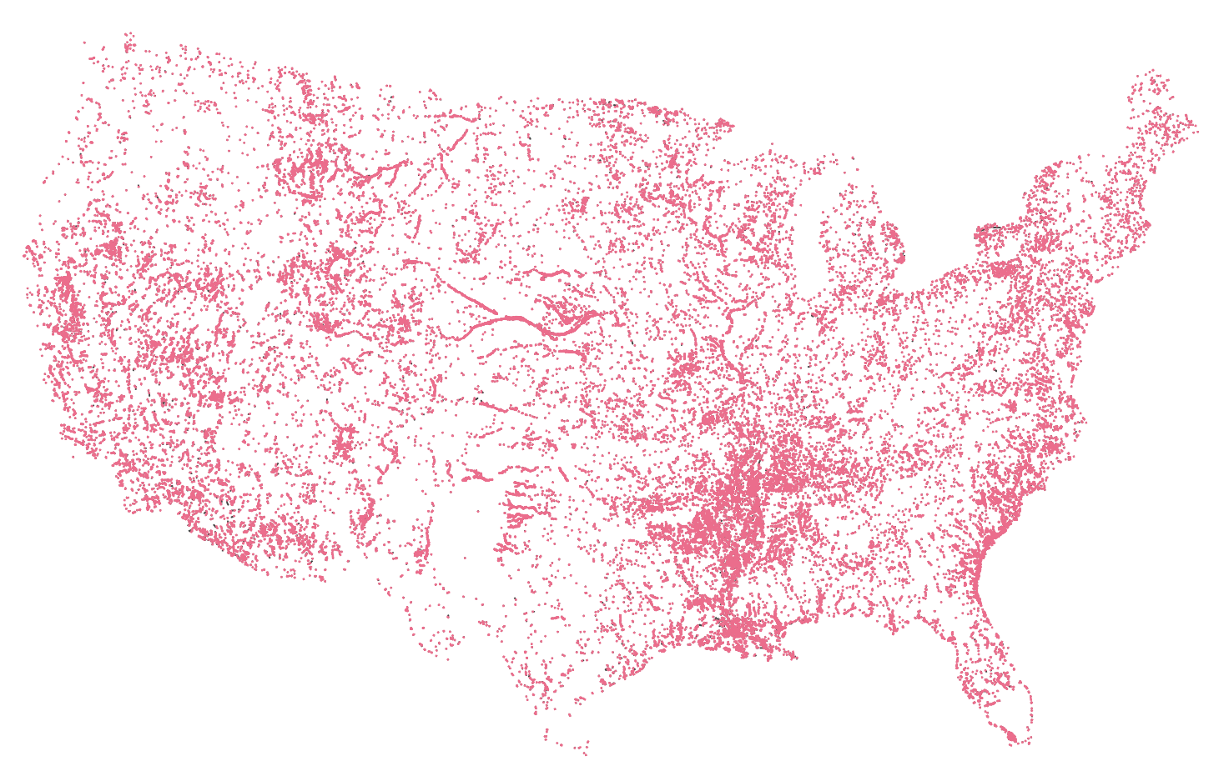
This 3-meter HAND is derived from the Fathom 3-meter DEM and NHDPlus V21 using an accelerated version of NOAA's Flood Inundation Mapping version 3 (FIM3).
Data:
Notice: due to storage limit, download is temporarily unavailable. Check back later. Sorry for the inconvenience!
https://cfim.ornl.gov/data/HAND/20200301/{huc6code}.zip
HAND and the Hydraulic Property Table version 0.2.0 was computed on the CADES Condo cluster at Oak Ridge National Laboratory on March 01, 2020. This version is created to correspond to data updates in the USGS 1/3 arcsec DEM, the USGS National Hydrography Dataset, including its Water Boundary Dataset, and the NHDPlus medium resolution dataset. This dataset comprises 331 HUC6 units for CONUS (excluding the five great lakes units), each is a downloadable zip file.
https://cfim.ornl.gov/data/HAND/20200601/{huc6code}.zip
HAND and the Hydraulic Property Table version 0.2.1 was computed on the CADES Condo cluster and a high-memory AMD machine at Oak Ridge National Laboratory. This version provides more complete HAND coverage, esp. around each HUC6 unit's boundary area. A new etching workflow is integrated to conduct a DEM burn-in process in order to resolve the elevation issue at intersections of river and road. This dataset comprises 331 HUC6 units for CONUS (excluding the five great lakes units), each is a downloadable zip file.
${HUCID}-wbd.shp		HUC unit boundary shape file, extracted from USGS WBD
${HUCID}-wbdbuf.shp		HUC unit boundary shape file, extracted from USGS WBD (buffered)
${HUCID}-flows.shp		Flowline shape file, extracted from NHDPlus V21
${HUCID}-inlets0.shp		Inlets point shape file in the HUC unit. Native projection
${HUCID}-inlets.shp		Inlets point shape file in the HUC unit. EPSG:4269
${HUCID}-weights.tif		Weight grid of the rasterized inlet points
${HUCID}.tif			Clipped HUC unit DEM from USGS 3DEP 10m elevation dataset (buffered)
${HUCID}bi.tif			Clipped HUC unit DEM etched by NHD HR (buffered)
${HUCID}fel.tif			Pit-removed DEM; output of TauDEM pitremove
${HUCID}p.tif			D8 flow direction raster; output of TauDEM d8flowdir
${HUCID}sd8.tif			D8 slope raster; output of TauDEM d8flowdir
${HUCID}ang.tif			Dinfinity flow direction raster; output of TauDEM dinfflowdir
${HUCID}slp.tif			Dinfinity slope raster; output of TauDEM dinfflowdir
${HUCID}ssa.tif			Contributing area raster; output of TauDEM aread8
${HUCID}src.tif			Stream grid; output of TauDEM threshold (threshold=1)
${HUCID}dd.tif			Buffered HAND raster; output of TauDEM dinfdistdown
${HUCID}hand.tif		HAND raster, buffer removed, final result
${HUCID}_catch.sqlite		Catchment polygons for all the river reaches in a HUC6 unit
${HUCID}_comid.txt		Catchment ID list for a HUC6 unit (COMID, slope, flowline length, and areasqkm)
${HUCID}catchmask.tif		Rasterized catchments with cell value to be the COMID of the corresponding river reach (buffered)
${HUCID}catchhuc.tif		Rasterized catchments in HAND extent

hydrogeo-fulltable-${HUCID}.csv	Hydraulic property table with the following fields:
CatchId,Stage,Number of Cells,SurfaceArea (m2),BedArea (m2),Volume (m3),SLOPE,LENGTHKM,AREASQKM,Roughness,TopWidth (m),WettedPerimeter (m),WetArea (m2),HydraulicRadius (m),Discharge (m3s-1)
Details of computing the hydraulic properties can be found in Zheng et al. 2018. Briefly:
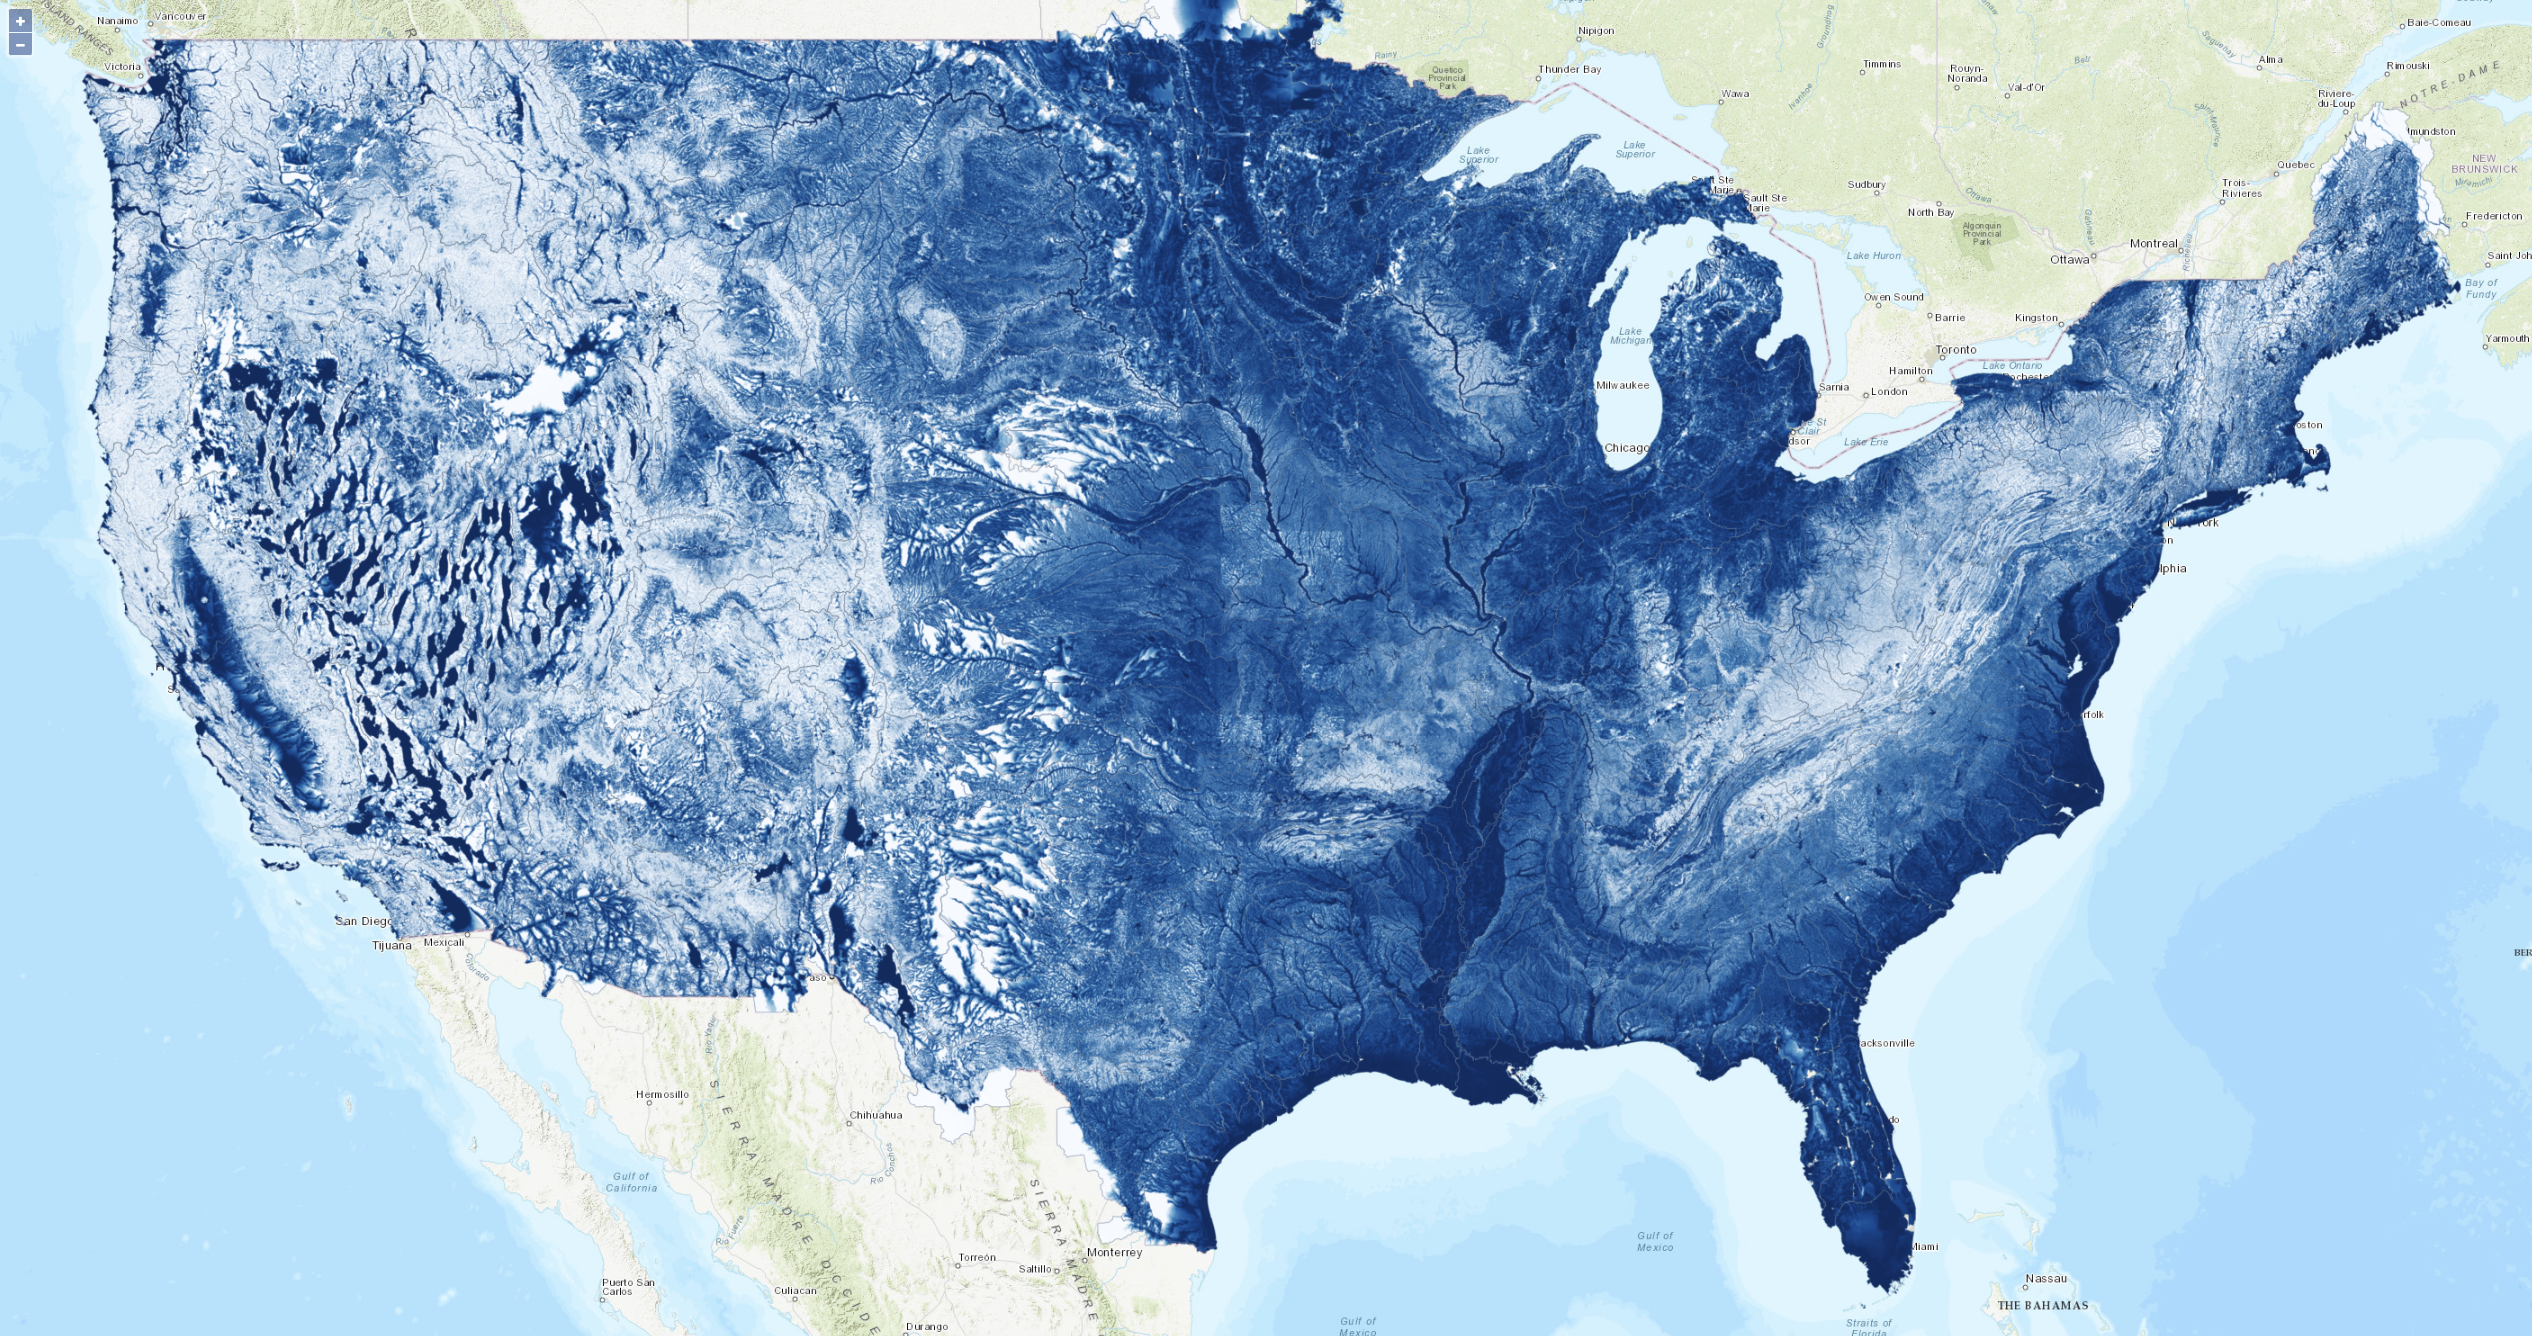
HAND is published as OSGeo Tile Map Service (TMS, https://wiki.osgeo.org/wiki/Tile_Map_Service_Specification) and can be rendered at a client as an XYZ layer. Note that TMS and XYZ standards differ in only one thing: Y tile coordinate. The conversion is simple: y' = 2^z - y - 1 (or in C, y = 1 << z - y - 1), where z is the zoom level (2^z is the total number of tiles at this zoom level).
If you want the CONUS view, configure the map layer as below:
{
	"type": "XYZ",
	"extent": [-14392000, 2436200, -7279500, 6594375],
	"url": "https://cfim.ornl.gov/data/HANDTMS/VERSION/{z}/{x}/{-y}.png",
	"projection": "EPSG:3857",
	"minZoom": 5,
	"maxZoom": 12
}
Remember to replace VERSION with the actual version number, e.g., v0.2.1.
The Continental Flood Inundation Mapping project is supported in part by the Laboratory Directed Research and Development Program of Oak Ridge National Laboratory, managed by UT-Battelle, LLC, for the US Department of Energy under contract DE-AC05-00OR22725.
This research used resources of the Compute and Data Environment for Science (CADES) at the Oak Ridge National Laboratory, which is supported by the Office of Science of the U.S. Department of Energy under Contract No. DE-AC05-00OR22725. We thank Chris Layton, Greg Shutt, Suzanne Parete-Koon, and Daniel Dewey for their support on provisioning CADES HPC (Condo and a AMD high-memory node) and Cloud resources.
The data registration and publishing used the Constellation Data Portal, a feature in the Scalable Data Infrastructure for Science (SDIS) at the Oak Ridge Leadership Computing Facility (OLCF) in Oak Ridge National Laboratory. We thank Ross Miller, Hyogi Sim, Sudharshan Vazhkudai, and Mitchell Griffith for their help in providing data management resources.
This resource is shared under the Creative Commons Attribution CC BY, http://creativecommons.org/licenses/by/4.0/
MAPS AND DATA DISCLAIMER
The Oak Ridge National Laboratory (ORNL) shall not be held liable for improper or incorrect use of the data described or information contained on this map or associated series of maps. The data and related map graphics are not legal, land survey or engineering documents and are not intended to be used as such.
ORNL gives no warranty, express or implied, as to the accuracy, reliability, utility or completeness of this information. The user of these maps and data assumes all responsibility and risk for the use of the maps and data. ORNL disclaims all warranties, representations or endorsements either express or implied, with regard to the information contained in this map product, including, but not limited to, all implied warranties of merchantability, fitness for a particular purpose or non-infringement.
This preliminary map product is for research and review purposes only. It is not intended to be used for emergency management operational or life safety decisions at the local or regional governmental level or by the general public. Users requiring information regarding hazardous conditions or meteorological conditions for specific geographic areas should consult directly with their city or county emergency management office.
###